Hi,
I am using Elipse E3 version 2.5
In case of communication failure, i need to show gap in historical trends or a discontinuity in between instead of representing a value that is descending to zero.
Regards,
Suraj

Hi,
I am using Elipse E3 version 2.5
In case of communication failure, i need to show gap in historical trends or a discontinuity in between instead of representing a value that is descending to zero.
Regards,
Suraj
Hello @surajkeer,
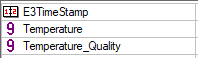
In this case you will need to change the property ShowBadPoints of this pen to False and include the field yourfield_quality in E3Chart query.
For example:
Screen.Item(“E3Chart1”).Pens.Item(“Pen1”).ShowBadPoints = False
Try it and tell me.
Best regards,
Link